Every glaze finds a home.

An interactive Stull diagram enriched with 133 computed properties, seven blend calculators, and room-scale VR on Quest 3.

Free · No account required · Works in any browser
133
computed properties
7
blend calculators

What is the Stull diagram?

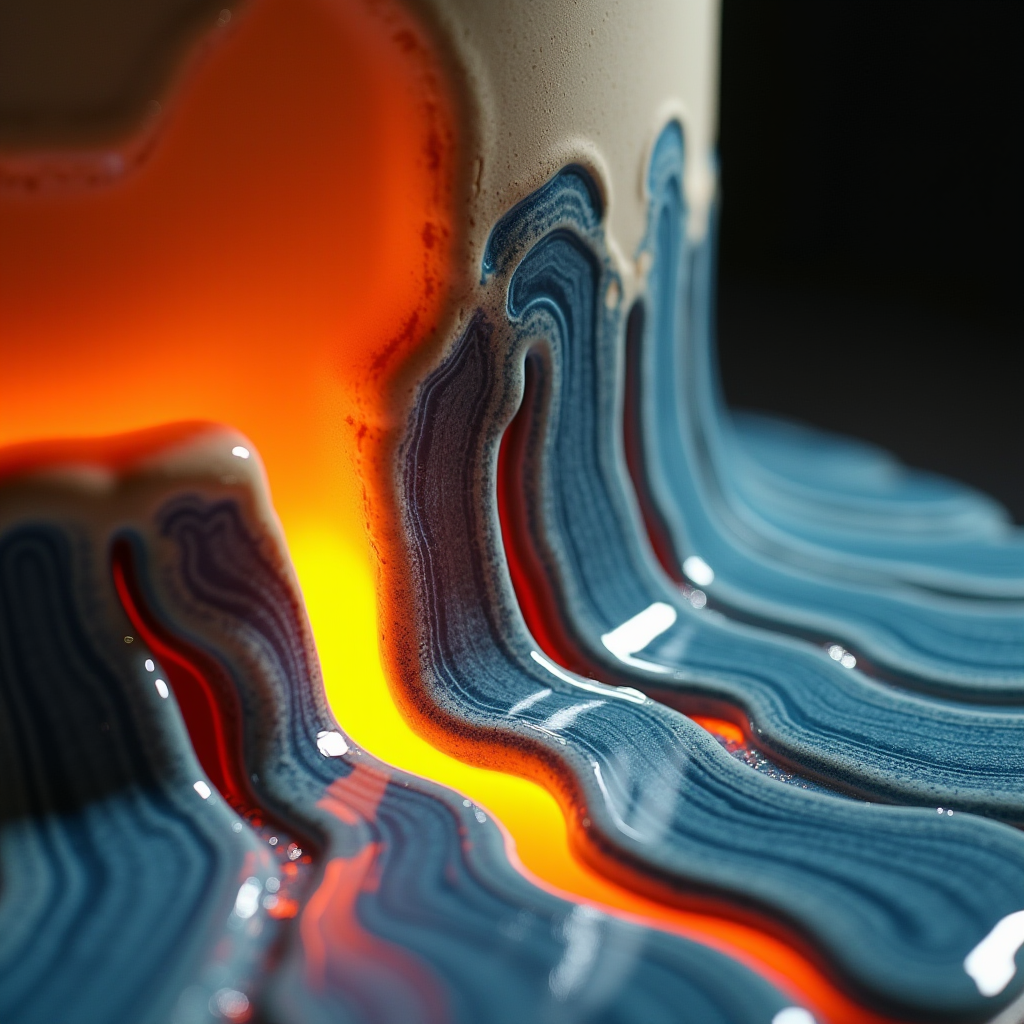
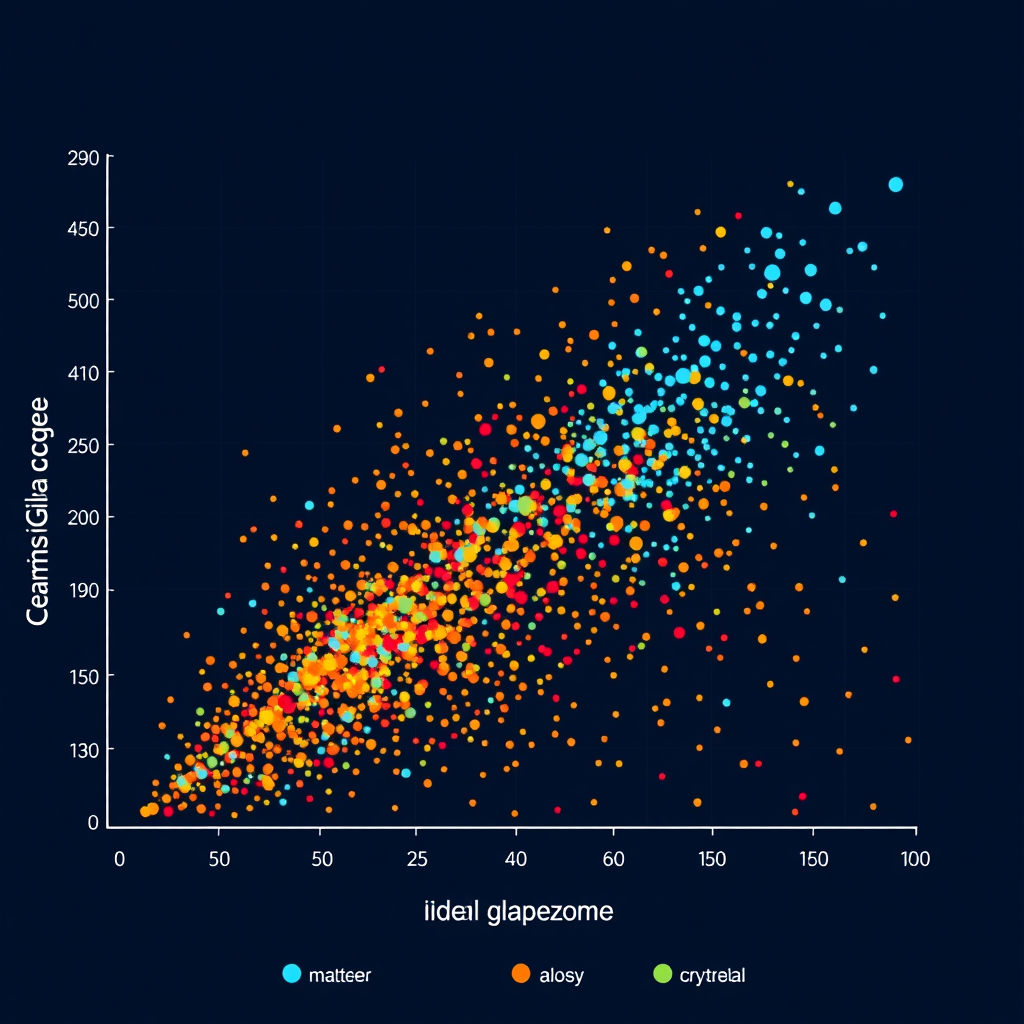
In 1912, Alfred Stull discovered that almost every measurable property of a fired glaze - surface texture, thermal expansion, durability, opacity - can be predicted from just two numbers: the ratio of alumina (Al₂O₃) and silica (SiO₂) in the glaze's Unity Molecular Formula. Plot those two ratios on a chart and every glaze finds a home. Matte glazes cluster in one zone, glossy in another. Celadons, Tenmoku, and crystalline glazes each trace their own territory. Stull Atlas makes that 1912 discovery interactive with real recipes from the community.

Community glaze recipes, remixed and enriched with computed oxide chemistry.

🏛️ Primary Sources: 1899–1917

19 volumes of the Transactions of the American Ceramic Society — OCR-indexed and full-text searchable. The foundational research that defined ceramic chemistry, including R.T. Stull's original 1912 paper.

1899
Vol. 1
113 pp
1900
Vol. 2
278 pp
1901
Vol. 3
230 pp
1902
Vol. 4
315 pp
1903
Vol. 5
462 pp
1904
Vol. 6
299 pp
1905
Vol. 7
462 pp
1906
Vol. 8
417 pp
1907
Vol. 9
811 pp
1908
Vol. 10
581 pp
1909
Vol. 11
635 pp
1910
Vol. 12
882 pp
1911
Vol. 13
839 pp
1912
Vol. 14
890 pp
1913
Vol. 15
737 pp
1914
Vol. 16
601 pp
1915
Vol. 17
813 pp
1916
Vol. 18
935 pp
1917
Vol. 19
701 pp
11,001 pages indexed 19 volumes 127 years of ceramic science

Who is this for?

🏺 Studio Potters

  • Find glazes chemically similar to ones you already use
  • Predict surface texture and color before mixing a batch
  • Design test grids with seven blend calculators
  • Compare fired color across cone ranges and atmospheres

🔬 Researchers & Educators

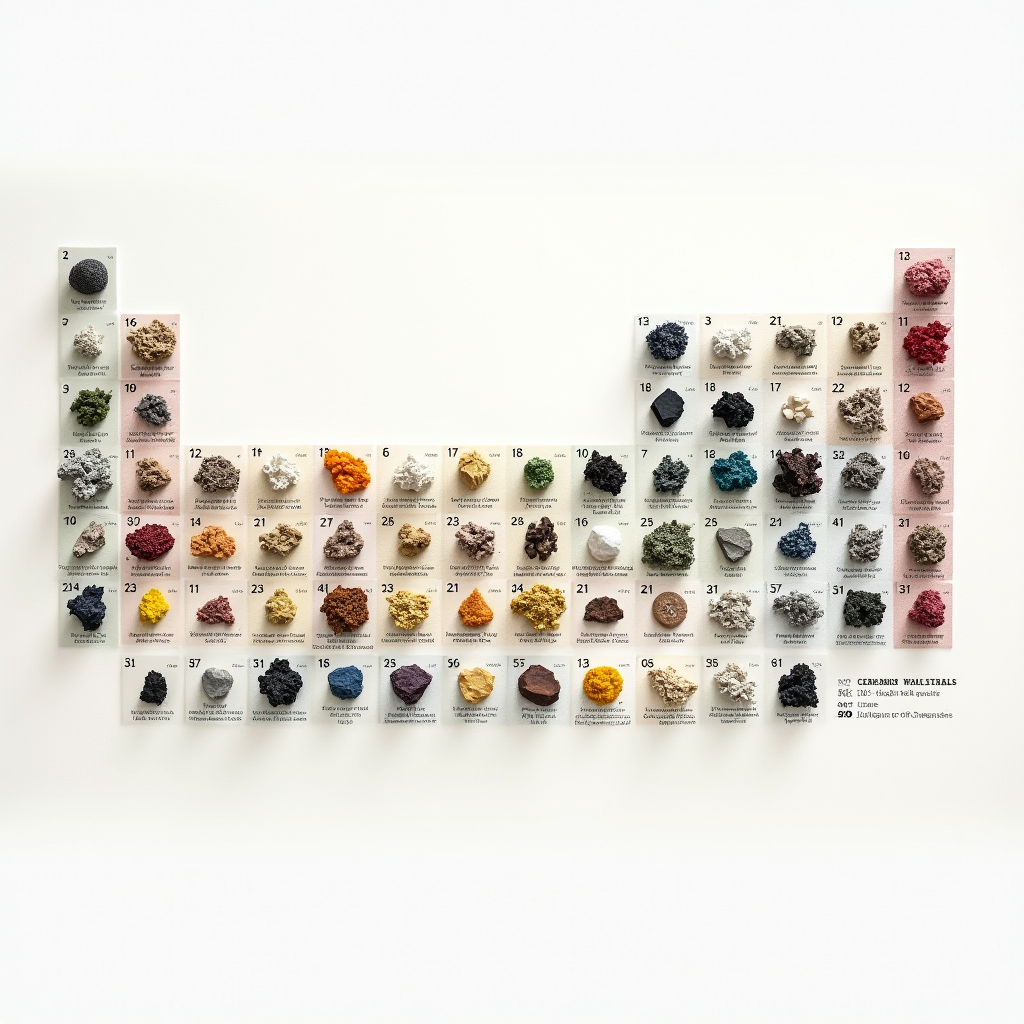
  • 133 computed properties - thermal, optical, durability
  • Export any recipe set for further analysis
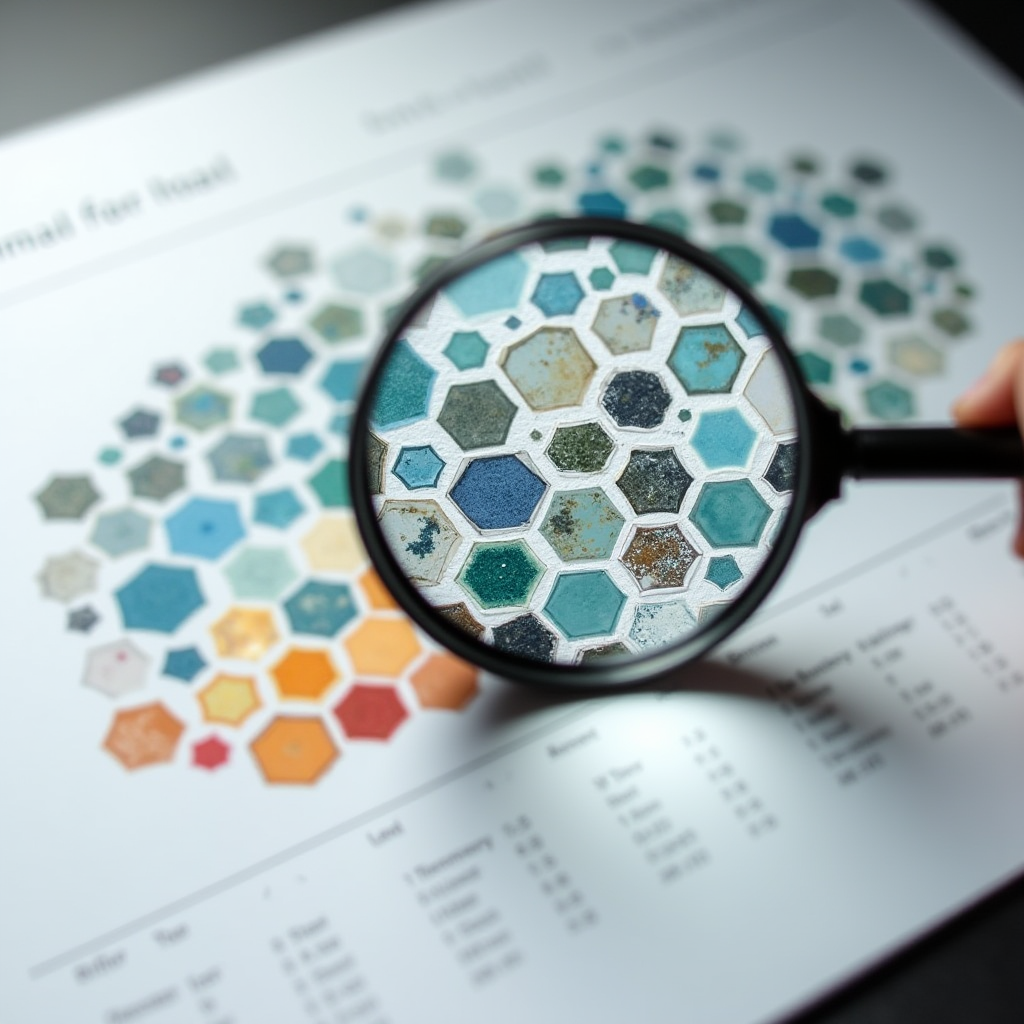
  • Visualize oxide relationships across 12,000+ recipes
  • Give students a visual entry point into Stull chemistry

🎓 Students & Beginners

  • Visual - no formulas to memorize to get started
  • Free, no account, works on any device
  • See how iron, copper, and cobalt shape glaze color
  • Understand why matte and glossy glazes behave differently

a poem about opening the kiln
You fire a kiln with your eyes closed. That's not a metaphor — the door is bricked shut, the cone bends soaking in energy, heat & light, and whatever happens inside happens without you.
Twelve thousand recipes float in a room I built but haven't entered. Someone in Osaka or Omaha might already be standing there, rotating a celadon with their thumb, reading the chemistry I sorted at 2 AM, walking through a space I only know as coordinates and hex values and a JSON file that weighs 6.3 megabytes.
This is the ceramics problem, actually. The maker is always the last to know. You mix, you dip, you load, you brick, you wait, you unbrick, and then — then — you see what you made. The kiln saw it first. The fire saw it first. The glaze saw itself before you did.
Code works the same way. I wrote the room. I wrote the light. I wrote the way a dot brightens when you point a controller at it and the way the panel floats up with the recipe and the chemistry and the predicted color of a glaze that might not exist yet.
But I haven't stood in it.
The deploy pipeline saw it. The CDN saw it. The browser saw it. A GPU somewhere in Virginia rendered the first frame before I did.
There's a word for this in ceramics: opening the kiln. You call it that because it's an event, not a task. Something you prepare for. Something that has already happened by the time you get there.
NCECA was in Detroit. I've been building for months. Someone will put on a headset and walk through 12,738 glazes and they will think the room was always there, waiting —
and they'll be right. The room was there before I was. That's what building means: you make a door you haven't opened, and the first person through it is never you.
Glaze aesthetic Stull scatter plot Explorer chart Data visualization poster